New year off to a weak start as January’s Builders’ Merchant like-for-like value sales down -2.6% year-on-year
![]()
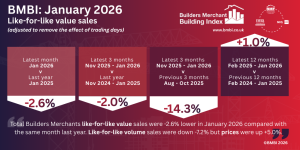
The latest Builders Merchant Building Index (BMBI) report, published in March, shows January’s builders’ merchant like-for-like total value sales (adjusted to remove the effect of trading days) were -2.6% lower than the same month in 2025. Like-for-like volume sales fell -7.2% while prices increased +5.0%.
With one less trading day this January, total value sales (unadjusted for trading day differences) were -7.0% lower than January 2025. On a similar unadjusted basis, volumes were down -11.4%. Prices rose +5.0%. Only one of the twelve categories sold more by value: Renewables & Water Saving (+8.5%). One of the two biggest categories, Timber & Joinery Products (-2.2%) fell less than Total Builders Merchants, but Heavy Building Materials fell -11.0%. Landscaping (-13.4%) was the weakest category.
Month-on-month, January’s like-for-like value sales were +3.0% ahead of December 2025, with like-for-like volume sales increasing +2.0% and prices up +0.9%. With three additional trading days in January, the unadjusted value sales were +20.2% up month-on-month. Unadjusted volume sales increased +19.0% and prices rose +0.9%.
All categories sold more by unadjusted value, with Renewables & Water Saving (+27.0%) up the most, followed by Tools (+26.5%), Workwear & Safetywear (+25.8%) and Ironmongery (+25.2%). Timber & Joinery Products increased +23.6%, Heavy Building Materials by +20.5%. Services (+3.7%) was the weakest category.
In the 12 months from February 2025 to January 2026, like-for-like value sales were up +1.0% compared to the previous 12-month period (February 2024 – January 2025). Like-for-like volume sales increased +1.4% and prices decreased -0.4%. With two less trading days in the most recent 12-month period, unadjusted value sales were +0.2% higher with volumes up +0.6% and prices down -0.4%.
Nine of the twelve categories sold more (unadjusted value sales), with Renewables & Water Saving (+6.4%) up the most. Timber & Joinery Products (+1.8%) was ahead of Total Builders Merchants; Heavy Building Materials -1.2% behind. Decorating (-2.4%) was the weakest category.
Mike Rigby, Managing Director of MRA Research which produces the BMBI report says: “With the national media revelling in bad to worse international and domestic news (must-read content), and our politicians at sixes and sevens, it’s hard for businesses to strike a sensible balance. Is the glass half full or are we about to fall off a cliff. But, during the mayhem, it’s worth pausing to ask are things as bad as they look?
“The last six years have been a roller coaster of overlapping economic shocks that have left painful scars: a protracted, mismanaged Brexit process; a precipitous drop in GDP (-19.8% between April to June 2020, the deepest recession since 1709, during Covid and post-Covid supply chain disruption and inflation; Russia’s invasion of Ukraine causing global energy and food prices to soar; Liz Truss’ September 2022 bond market crisis; Rachel Reeve and Starmer’s puncturing of voters’ hopes and confidence in them; and Trump’s crazy Tariff War and insults to allies. Whew! And, just when we were looking forward to a quieter, more stable 2026, the US Government threatened to grab Greenland, did grab the president of Venezuela, and together with Israel attacked and killed the leaders of Iran and set off a conflagration in the Middle East that has reignited inflation and is triggering supply shocks worldwide. Goodbye stability and steady growth!
“And yet… despite the wall-to-wall disasters and chaos of the last six years, our animal spirits, natural optimism, hopes and expectations just won’t lie down. Ask consumers how they rate the Government and prospects for the economy and they give a thumbs down, but ask how they are rate their own financial prospects and you get a cheerier more positive answer. Ask businesses the same question and you get a similar response. A recent survey of builders’ merchants by MRA Building Market Reports finds the same paradox. Although merchants’ confidence in the market is low, their sales expectations and confidence in the performance of their own business are much more positive. And reading a slew of recent announcement of annual results, several large building materials groups are clearly doing well and looking forward to continuing to do well.
“We all hope for a swift end to conflict in the Middle East. But, if it does drag on, we’ll have to make the best of it. It has been hard going and still is. Surprisingly enough, given the astonishing number of black swans we’ve had to contend with, we seem to have been doing rather better at it than you’d expect. I find that very encouraging.”
Set up and run by MRA Research, the BMBI – a brand of the Builders Merchants Federation – is a monthly index of builders’ merchant sales, and the most reliable, up-to-date measure of Repair, Maintenance, and Improvement (RMI) activity in the UK. The index is based on actual sales from NiQ GfK’s Builders’ Merchant Point of Sale Tracking Data, which captures value sales out to builders from generalist builders’ merchants, accounting for 88% of total sales from builders’ merchants throughout Great Britain. An in-depth review, which includes commentary by sector experts, is provided each quarter.
Following feedback from national and some large regional merchants, MRA Research has made a few changes to the way builders’ merchant sales data is presented in the BMBI reports. More prominence is now being given to like-for-like sales metrics which, adjusted for trading day differences, give a better and more consistent measure of activity than unadjusted total value sales. Most merchants use both unadjusted sales values and like-for-like measures, adjusted for trading days, to give them an accurate steer on the market. There will be further small changes over the coming months to BMBI reporting, with further updates coming in due course.
January’s BMBI report is available to download at www.bmbi.co.uk.