P&H Merchants like-for-like April sales up +0.5% year-on-year
![]()
The latest figures from the Plumbing & Heating Merchant Index (PHMI) report show like-for-like value sales (adjusted to remove the impact of trading days) for April 2026 through specialist plumbing and heating merchants were up +0.5% compared to the same month in 2025. Like-for-like volume sales were down -4.2%, while prices increased +4.9%. There was no difference in trading days.
Compared to March, April like-for-like value sales were -4.9% lower, with month-on-month like-for-like volume sales up +1.1% and prices down -5.9%. With two less trading days in April, unadjusted total value sales were down -13.5%. Unadjusted volumes fell -8.1% and prices were also down (-5.9%).
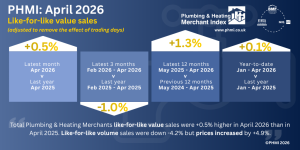
Like-for-like value sales in the three-months February to April 2026 were down -1.0% compared to the same period the year before. Like-for-like volumes sales decreased -4.7% but prices increased +4.0%. With one extra trading day in the most recent period, unadjusted value sales were up +0.7%. Volume sales were down -3.2% and prices rose +4.0%.
Compared to the previous three-months (November 2025 – January 2026), February to April 2026 like-for-like value sales decreased -1.6%. Like-for-like volume sales were +0.9% up but prices were -2.5% lower. With three additional trading days in the most recent three-month period, unadjusted value sales were +3.4% higher. Unadjusted volume sales were +6.0% higher and prices -2.5% lower.
Plumbing & Heating merchants’ like-for-like value sales in the 12-months May 2025 to April 2026 were +1.3% higher than the previous 12 months (May 2024 to April 2025). Like-for-like volume sales were -3.1% down as prices increased +4.6%. There was no difference in trading days.
April’s PHMI like-for-like value sales index was 131.4. With one less trading day versus the base Index period, the unadjusted value index was 127.1.
Mike Rigby, Managing Director of MRA Research which produces the PHMI report says: “So far, 2026 has been a series of surprises, mostly unwelcome. Now, as we reach the midpoint of the year, what we want is what we were led to expect: positive signs of consistent growth. But this may be some way off. On the negative side of the ledger, new home registrations were down -6% in Q1 as rising costs and falling demand created poor market conditions for developers, with eight out of 12 regions seeing a decline.
“Real estate companies (estate agents, landowners and estate management companies) are going bust at the fastest rate seen in the last 10 years as the UK’s property market takes a battering. Since the start of the year, 762 property related businesses have become insolvent in the UK. That’s more than 60 per cent up on last year as the Iran war stifles consumer confidence and adds to building costs.
“And there’s no mitigating the turmoil and uncertainty at the heart of Government.
“But on the sunny side of the ledger, the US-Iranian war, and maybe even the Middle East war, seems to be coming to an end. It’s an unpopular war even in the US, so now he has a face-saving exit President Trump will be keen to move on. Assuming Israeli Prime Minister Netanyahu doesn’t torpedo the peace, oil and gas prices will drop, the inflation spike will be short lived and the prospects for growth will rise. True, it will take months for ships to get to where they should be and for stocks to be rebuilt, and years to repair or rebuild some infrastructure, but this appears to be a very positive turning point.
“The latest GfK Consumer Confidence Index suggests things are starting to improve too. The May index was two points up to -23, with the mood lifting for personal finances and the economic outlook. However, the Major Purchase Index, indicative of intended spend on repair, maintenance and improvement (RMI), was down -2 points to -20, and the Savings Index dropped a remarkable -10 points. People are feeling the pinch and using savings to prop up day-to-day spending.”
The Plumbing & Heating Merchant Index (PHMI) is the first to analyse point of sales data collated from specialist plumbing & heating merchants with combined annual sales of £3bn, to chart their performance month-to-month.
Based on data from NIQ GfK’s Plumbing & Heating Merchant Panel, which represents over 70% of the market by value, the report provides reliable data and a platform and voice for the industry, as well as for leading plumbing & heating brands. It is produced by MRA Research for the Builders Merchants Federation. There is no overlap or double counting between PHMI and the Builders Merchants Building Index (BMBI) sales data.
Following feedback from national and some large regional merchants, MRA Research has made a few changes to the way the plumbing and heating merchants’ sales data is presented in the PHMI reports. More prominence is now being given to like-for-like sales metrics which, adjusted for trading day differences, give a better and more consistent measure of activity than unadjusted total value sales. Most merchants use both unadjusted sales values and like-for-like measures, adjusted for trading days, to give them an accurate steer on the market. There will be further small changes over the coming months to PHMI reporting, with further updates coming in due course.
To download the latest report, or learn more about becoming an Expert, speaking on behalf of your market, visit www.phmi.co.uk.