Merchants’ sales up 6% in May compared to April 2019 – but flat year on year
Year on year
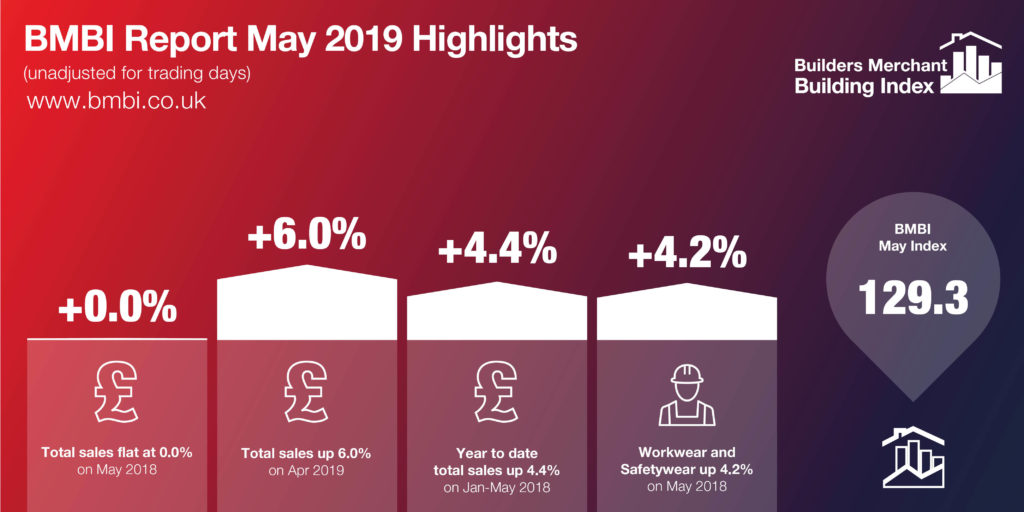
Total Builders Merchants value sales in May 2019 were flat (+0.0%) compared with the same period in 2018. Following strong growth in the period February to April, sales were somewhat disappointing in May – in particular for Landscaping, which had seen three months of double-digit growth, but a sales increase of only 0.4% in May compared to last year. Both Timber & Joinery Products (+0.9%) and Heavy Building Materials (+0.3%) saw sales increase only marginally. The strongest category was Workwear & Safetywear, in which sales had increased by 4.2%.
Many sectors, including Tools (-5.4%), Decorating (-1.9%), Plumbing, Heating & Electrical (-2.0%) and Kitchens & Bathrooms (-2.3%) reported lower sales in May 2019 compared to last year.
This more subdued performance was echoed in ONS construction output figures, and consumer confidence remains low. Total output in May 2019 had grown compared with last year, but RMI output was down by 1.8%, and the most significant drop was seen in private housing RMI (-6.8%) in the month.
Month on month
Total Builders Merchants sales were up 6.0% compared with the previous month. Sectors that performed well on a month-by-month unadjusted basis included Landscaping (up 10.7%), Heavy Building Materials (up 6.7%), Tools (up 5.0%) and Decorating (up 4.9%).
However, the adjusted May 2019 figures, which take into account the trading day difference, show that on a like for like basis, Total Builders Merchants’ sales in May were just 1% higher than April and all categories except Landscaping and Heavy Building Materials had seen a fall in sales compared to April.
Index
May’s BMBI index was 129.3, with Landscaping the highest category at 171.1 – it’s highest index ever – but all other sectors were positioned below the Total Builders Merchants index.
Produced by MRA Marketing, the Builders Merchant Building Index report contains data from GfK’s Builders Merchants Panel, which analyses data from over 80 of generalist builders’ merchants’ sales throughout Great Britain. The full report with index tables and charts is available to download at www.bmbi.co.uk/.