November merchant sales show pre-election dip

November merchant sales show pre-election dip
The short trading day month of November saw subdued sales for merchants with the lowest total sales in 10 months.
Year-on-Year
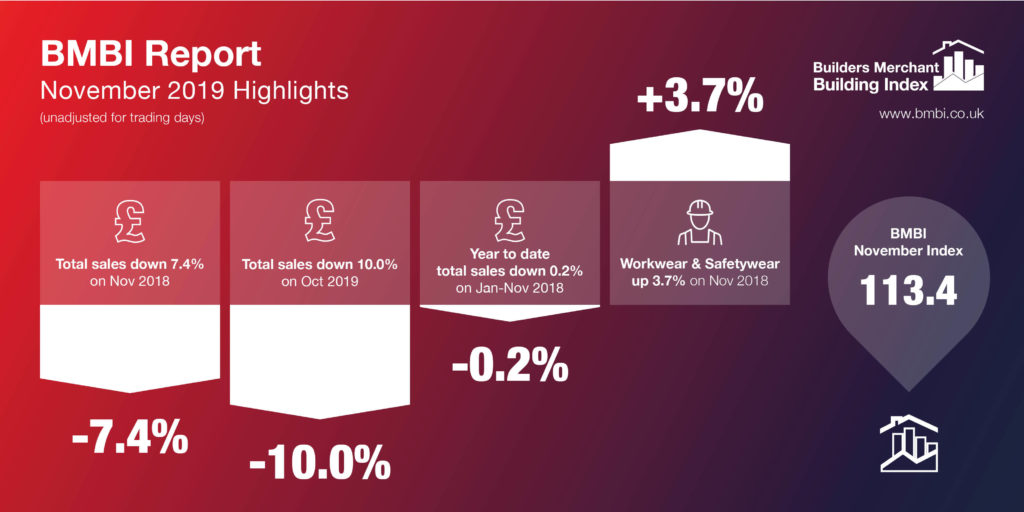
Total Builders’ Merchant sales in November were down 7.4% compared with the same month in 2018. On one less trading day, average sales a day were 3% down. The best performing sectors in November were Renewables & Water Saving (+5.3%) and Workwear & Safetywear (+3.7%). As average sales a day, Renewables & Water Saving were up 10.3%, Workwear & Safetywear up 8.6%.
Tools (-12.7%), Timber & Joinery (-9.6%), Ironmongery (-8.0%), Heavy Building Materials (-7.9%) and Landscaping (-7.4%) were particularly affected, although a little less dramatically on a sales a day basis (8.5%, -5.3%, -3.6%, -3.5% and -3.0% respectively).
Month-on-Month
Compared with the previous month, October 2019, November’s sales were 10.0% down. However, when adjusted for two less trading days in November, sales were down 1.4%.
All product categories were down month-on-month, including Heavy Building Materials (-10.9%), Timber & Joinery (-10.0%) and Ironmongery (-9.8%). Adjusted for trading days, the strongest performing sectors were Workwear & Safetywear (+9.3%) and Kitchens & Bathrooms (+8.0%).
Other periods
Sales in the 12 months December 2018 to November 2019 were down 0.2% on the same period last year. However, adjusting for one less trading day year-to-date sales are slightly ahead at 0.2%.
Index
November’s BMBI index was 113.4, with Plumbing, Heating & Electrical the highest at 134.6.
About the BMBI
Produced by MRA Marketing, the Builders Merchant Building Index report contains data from GfK’s Builders Merchants Panel, which analyses data from over 80 of generalist builders’ merchants’ sales throughout Great Britain. The full report with index tables and charts is available to download at www.bmbi.co.uk/.
