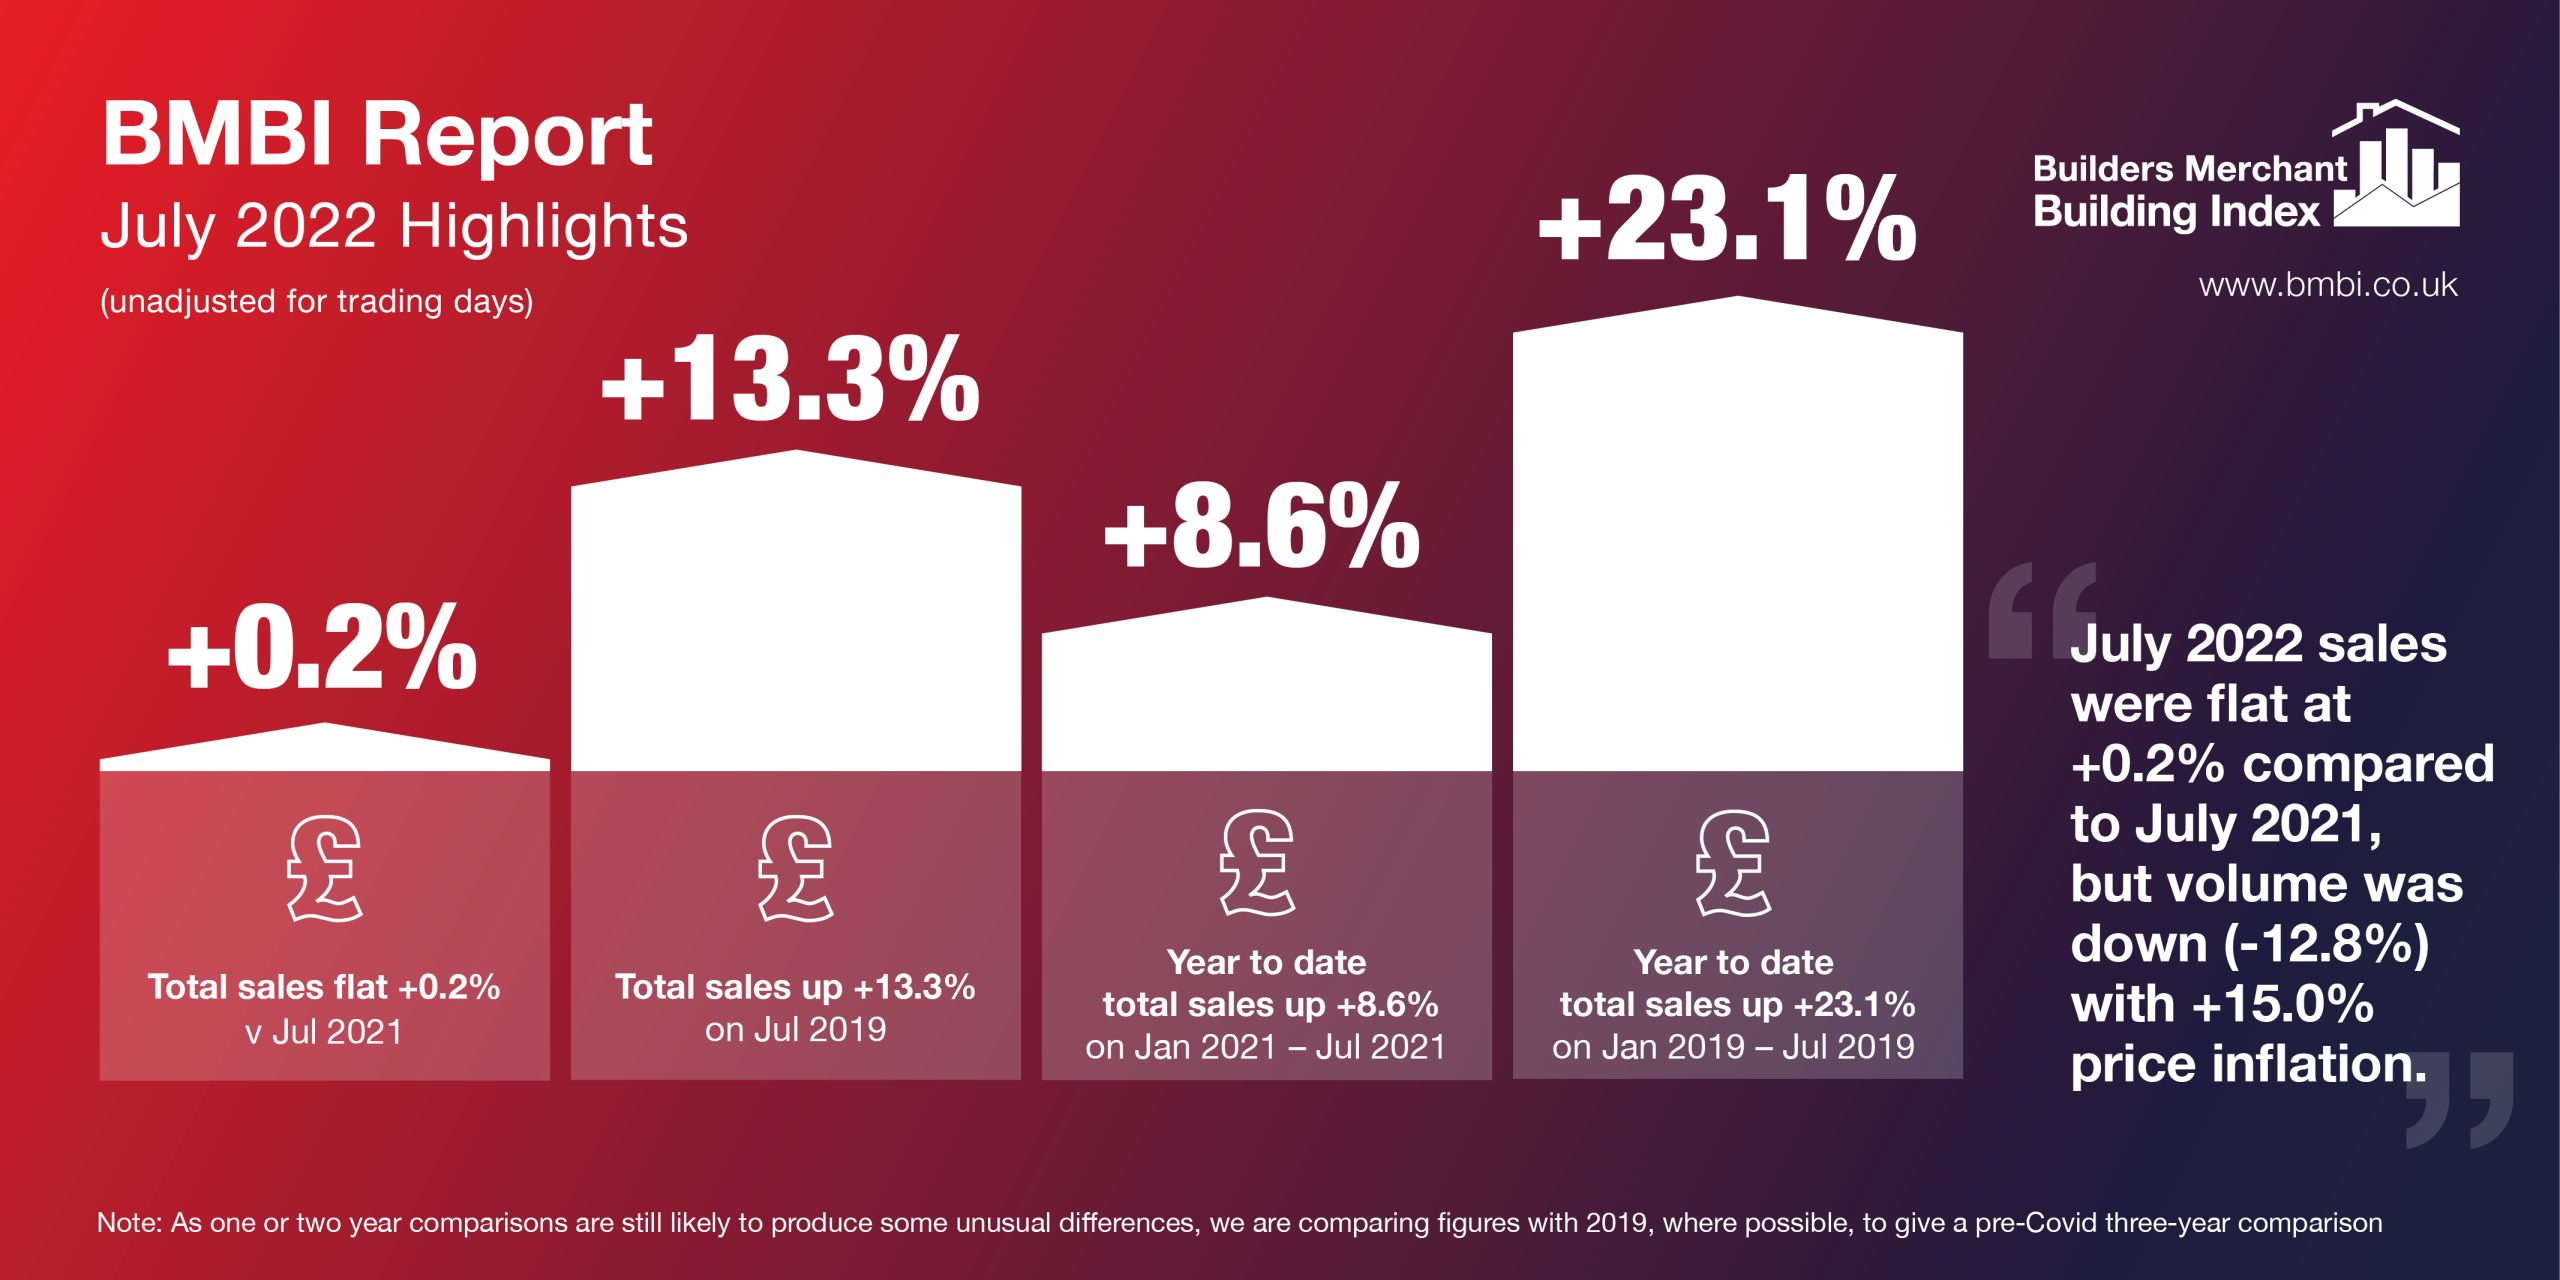
July’s value sales were flat +0.2% compared with July 2021 – compared with pre-Covid July 2019, sales were +13.3% higher
![]()
Total Builders Merchants value sales were flat (+0.2%) in July 2022 compared July last year. Volume sales were -12.8% lower with price up +15.0%. There was no difference in trading days. Ten of the twelve categories sold more. Nine categories performed better than Merchants overall, including Renewables & Water Saving (+25.5%) Workwear & Safetywear (+20.2%), Kitchens & Bathrooms (+13.1%) and Plumbing, Heating & Electrical (+10.7%). Landscaping (-4.6%) and Timber & Joinery Products (-14.4%) sold less.
Total value sales in July 2022 were +13.3% up on the same month three years ago (a more normal year pre Covid). Volume sales fell -13.9% – prices rose +31.6%. With two less trading days this year, like-for-like sales (which take trading day differences into account) were up +24.1%. Three of the twelve categories sold more than merchants overall. Timber & Joinery Products (+23.8%), Renewables & Water Saving (+18.6%) and Landscaping (+17.7%) did best. Other categories grew more slowly, including Heavy Building Materials (+12.3%), Kitchens & Bathrooms (+11.3%) and Plumbing, Heating & Electrical (+2.9%). Miscellaneous (-4.5%) was weakest.
Total Merchants sales were -2.6% lower in July 2022 than in June 2022. Volume sales were -5.2% down with price up +2.7%. With one more trading day like-for-like sales were -7.3% down this month. Renewables & Water Saving (+4.8%) grew most. Landscaping (-9.1%) was weakest.
July’s overall BMBI index was 151.5, particularly helped by Landscaping (195.5) and Timber & Joinery Products (171.0), with no difference in trading days. Almost all categories recorded indices exceeding 100, including Heavy Building Materials (147.0), Kitchens & Bathrooms (143.1) and Ironmongery (135.3). Only Renewables & Water Saving (90.4) fell below 100.
Total sales in May to July 2022 were +4.4% higher than in May to July 2021, with price inflation of +16.5%, volume down -10.4%, and no difference in trading days. Ten of the twelve categories sold more than merchants overall. Renewables & Water Saving (+20.0%), Kitchens & Bathrooms (+17.4%) and Workwear & Safetywear (+14.4%) did best. Timber & Joinery Products (-7.2%) was weakest.
Compared with the same months three years ago (May to July 2019), May to July 2022 sales were ahead +22.4%, driven by price (+30.0%) not volume (-5.8%). With two less trading days this period like-for-like sales were +26.4% ahead. All categories sold more. Two categories stood out: Timber & Joinery Products (+33.4%) and Landscaping (+31.3%). Heavy Building Materials (+20.5%), Kitchens & Bathrooms (+19.0%), and Plumbing, Heating & Electrical (+10.7%) grew less. Tools (+3.6%) was weakest.
Total sales in May to July 2022 were +4.2% up on the previous three months, February to April 2022, driven more by price inflation (+2.5%) than volume (+1.6%), with no difference in trading days. Ten of the twelve categories sold more. Landscaping (+8.8%) and Heavy Building Materials (+7.3%) did better than merchants overall. Decorating (+3.9%), Kitchens & Bathrooms (+2.2%) and Ironmongery (+1.2%) grew less. Plumbing, Heating & Electrical (-8.6%) was weakest.
The current year to date, January to July 2022, was +8.6% higher than January to July 2021. Volume sales were -6.7% lower with price up +16.3%. With one less trading day this year like-for-like sales were +9.3% higher. All categories sold more. Kitchens & Bathrooms (+20.8%) was strongest followed by Renewables & Water Saving (+20.7%). Plumbing, Heating & Electrical (+12.7%) Heavy Building Materials (+12.0%) and Decorating (+9.3%) grew more than merchants overall. Landscaping (+0.5%) was weakest.
Sales in the current year to date, January to July 2022 were +23.1% ahead of three years ago – January to July 2019. Price inflation was +26.7%, and volume was down -2.8%. With three less trading days in the most recent period like-for-like sales were +25.7% higher. All categories sold more. Landscaping (+39.4%), Timber & Joinery Products (+36.4%) and Renewables & Water Saving (+28.4%) performed better than Merchants overall. Tools (+4.9%) was weakest.
Total Merchants sales in August 2021 to July 2022 were +11.5% higher than in August 2020 to July 2021, with price inflation of (+16.5%), and volume (-4.2%). No difference in trading days. All categories sold more. Renewables & Water Saving (+17.2%) grew most. Kitchens & Bathrooms (+16.6%), Timber & Joinery Products (+14.8%), Heavy Building Materials and Plumbing, Heating & Electrical (both +11.9%) also did well. Workwear & Safetywear (+2.8%) was weakest.
Total Merchants sales in August 2021 to July 2022 were +20.4% higher than in the 12 months August 2018 to July 2019. With two less trading days in the most recent period like-for-like sales were +21.3% higher. Eleven of the twelve categories sold more with Timber & Joinery Products (+39.1%) and Landscaping (+36.1%) well out in front. Other categories saw lower growth including Heavy Building Materials (+14.7%), Kitchens & Bathrooms (+13.9%) and Plumbing, Heating & Electrical (+6.0%). Tools (-1.5%) was weakest.
Developed and run by MRA Research, the BMBI – a brand of the Builders Merchant Federation – is a monthly index of builders’ merchant sales, and the most reliable, up-to-date measure of Repair, Maintenance, and Improvement (RMI) activity in the UK. The index is based on actual sales from GfK’s Builders’ Merchant Point of Sale Tracking Data, which captures value sales out to builders from generalist builders’ merchants, accounting for over 80% of total sales from builders’ merchants throughout Great Britain. An in-depth review, which includes commentary by sector experts, is provided each quarter.
The July 2022 BMBI report is available to download at www.bmbi.co.uk.