What’s beyond the numbers? Understanding the significance of value vs volume sales

Mike Rigby, CEO of MRA Research, asks Emile van der Ryst of GfK to make sense of the apparent anomalies between volume and value figures in BMBI reports.
In the last three years, building materials supply has been hit by Covid and its lockdowns, intense supply shortages and soaring inflation. And we’ve got acclimatised to seeing their effects reflected in the BMBI reports which show very different numbers from the ones we’re used to.
Traditionally, construction market numbers have moved sedately up or down within relatively narrow bands. Normal was plus or minus two or three percent, and anything over five per cent was a significant movement.
But since Covid we’ve had to get our heads around huge swings of plus or minus 20% or so, sometimes much more.
Fortunately, the BMBI Experts have helped us make sense of these trends, forces and issues that have been driving supply and demand in these markets.
Until the recent bout of inflation, value and volume marched broadly together or diverged only gradually. If value rose 5% you could assume very broadly that volume had gone up by a similar amount.
Now, value figures can be rocketing up, while volume is dropping sharply, driven by a combination of strong cost inflation and weak markets,
More confusingly, changes in the category mix have been throwing up hard-to-understand total numbers.
In the January and Q1 BMBI reports we asked Emile van der Ryst, Senior Client Insight Manager – Trade, GfK to make sense of some of these apparent anomalies for us:
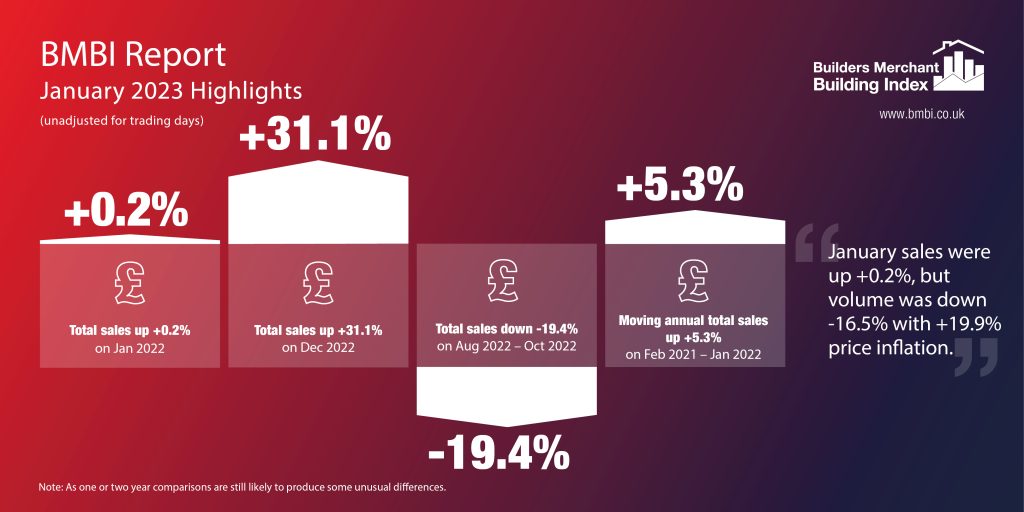
“Market turmoil in the past year has now reached the stage where some of the monthly figures need further context. For example, January 2023 on January 2022 saw a +0.2% value increase, with a -16.5% volume decrease, and a +19.9% price increase. Logic dictates that value should therefore be around +3-4% if volume and price are balanced against each other.
“However, January was affected by Heavy Building Materials, Timber & Joinery and Landscaping distorting the total market view.
“These three categories combined make up around 75% of total market value, and therefore heavily influence topline trends. But they are each quite different in the mix.
“Heavy Building Materials has one of the lowest average prices of the categories but has seen a larger than market average price growth.
“At the same time, Timber & Joinery has one of the highest average prices, but has seen lower than market average volume declines, with prices declining against rampant total market inflation.
“Finally, Landscaping is a key volume driver in the market, but has seen a larger than market average seasonal volume decline. These factors in combination occasionally create hard-to-understand distortions, unexpected anomalies in topline trends which need to be seen in context.
“We expect these trends to continue into next year as inflation, demand and supply gradually return to a more normal stability. Where possible GfK will try to add further context to explain these trends.”
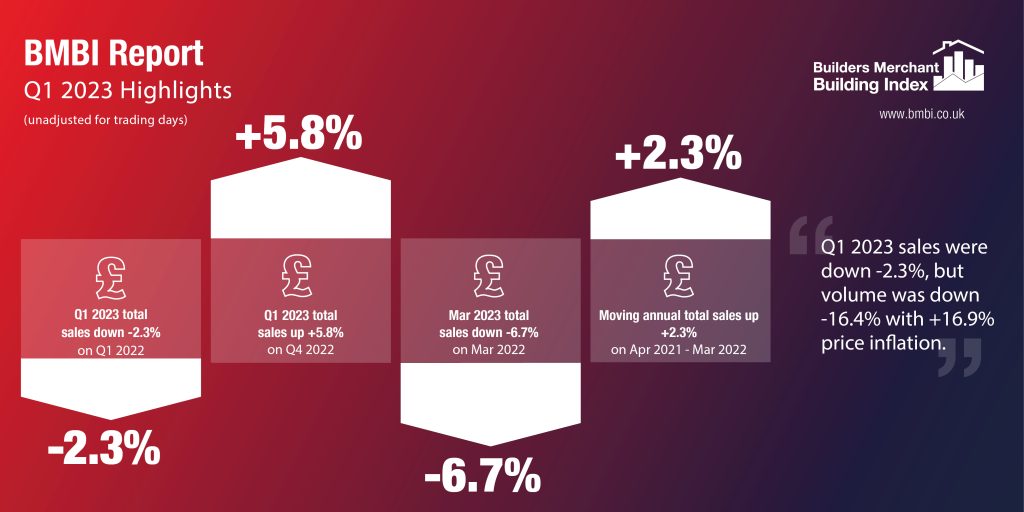
For the BMBI Q1 2023 Report, Emile van der Ryst added the following context: “The price growth shown in the BMBI is higher than the inflationary figures quoted by some of the leading merchants in the market. It is however important to note that GfK tracks price growth and not inflation, with price growth being a combination of shifts in category/product mix, as well as inflation.
“The higher price growth is therefore a reflection of the stronger volume performance of some of the higher priced categories in the sector, such as Drainage / Civils / Guttering, Plaster, Plasterboard and Insulation. Timber and Sheet Materials continue to contribute to this as well through volume performance, even though the pricing of both continue to decline.
“This forms part of the unusual trends GfK anticipate seeing throughout 2023, going into 2024.”
For more insight and commentary on the BMBI reports, visit bmbi.co.uk/